Configure Company Webhooks
Objective
To configure the Webhooks feature to receive notifications when one or more Procore API resources change at the Company level.
Background
The Webhooks feature enables third-party developers and integrators to specify one or more Procore API resources for which they want to be notified when Create, Update or Delete actions occur. The user interface for configuring the Webhooks feature is available through the Company's Admin tool in Procore.
The benefits of the Webhooks feature include:
- Removing the need for polling logic/code in third-party integrations to determine resource changes
- Improved performance by replacing polling with asynchronous updates
- Increased efficiency as code only needs to run when a resource changes
- Reduced risk of exceeding Procore API rate limit caps
Things to Consider
- Required User Permissions:
- 'Admin' level permissions on the Company level Admin tool.
- Developer Information:
- Refer to the Introduction to Webhooks and Using the Webhooks API guides on the Developer Portal for information on developing your application or integration to properly support Webhooks.
Steps
- Navigate to the Company level Admin tool.
- Under 'Company Settings', click Webhooks.
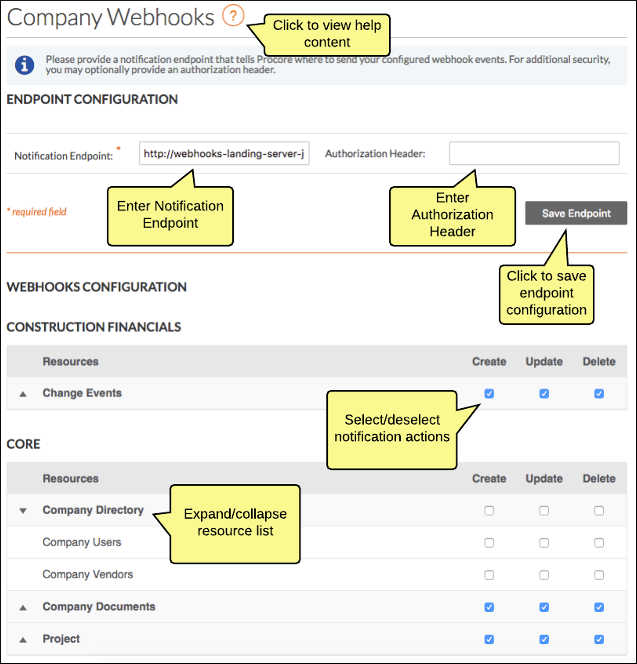
This opens the 'Webhooks' configuration page that includes a Notification Endpoint field for entering your web server URL and a Resource Grid for selecting the resources and corresponding change actions for which you want to receive notification.

- Do the following:
- In the Resource Grid, place a check mark in the 'Create', 'Update', and 'Delete' boxes for any resources for which you want to receive corresponding notifications. Note that your action selections take effect immediately as you make them, there is no need to 'submit' your changes.
Note: Keep in mind as you configure Webhooks that you are merely identifying which resources/actions you want to receive notifications on. Only when an actual change occurs to a resource will you then receive a notification.
Webhooks Deliveries
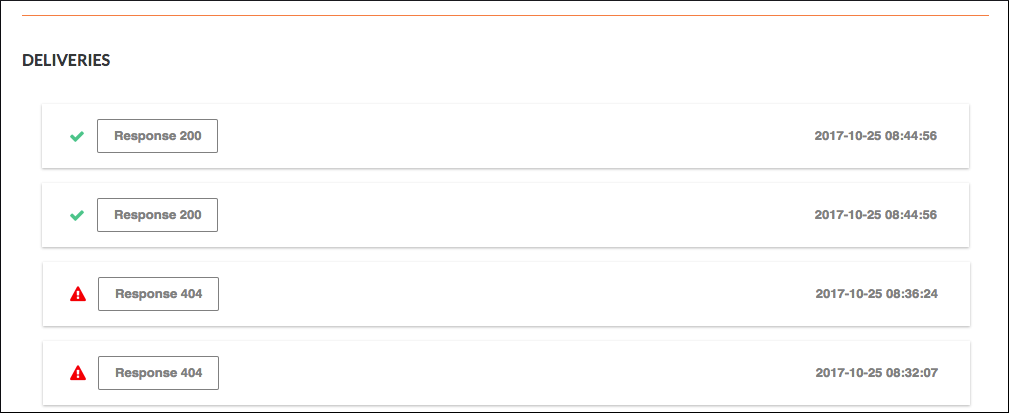
A running log of Webhooks Deliveries to your notification endpoint is available at the bottom of the Company Webhooks page. The Deliveries section allows to quickly see the status of events that Procore has sent (or has attempted to send) to your notification server. Both successful as well as failed deliveries are included in the display by default. You can use the Only Show Failures checkbox to filter the display to only display failed deliveries.

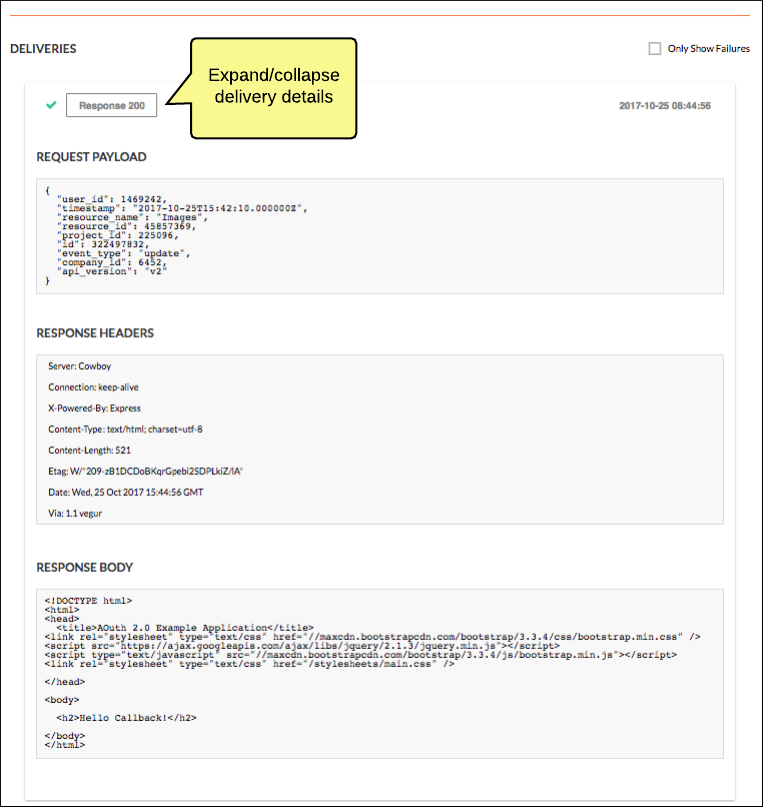
The most recent deliveries appear at the top of the Deliveries section. Clicking a delivery entry exposes details on the Request Payload, Response Headers and Response Body.

The display of the deliveries log is paginated with a maximum of 25 deliveries displayed at a time. Click More Deliveries to display the next set of 25 deliveries.

Monitoring and Alarms
We strongly recommend that you set up proper monitoring of your notification endpoint servers to ensure that any downtime or other performance-related issues are identified and that you are notified in a timely manner via a reliable alarm system. Many commercial monitoring systems are available that can serve this purpose including Datadog, New Relic, and others. These services provide robust monitoring features that allow you to easily visualize the health of your system through configurable charts, graphs, and real-time analytics. These services also provide built-in alerting so that you are promptly notified when problems occur.
See Also
- For information on configuring Webhooks at the Project level, see Configure Project Webhooks.

