Create a Custom Report in Portfolio Financials and Capital Planning
Note
The information in this tutorial applies to accounts with the Portfolio Financials product in Procore. Reach out to your Procore point of contact for more information.Objective
To create a custom report in Portfolio Financials and Capital Planning.
Background
The Reporting tool is a hub for configuring various types of custom and default reports. All data points are updated automatically based on activity within the project, such as tenders being awarded and invoices being approved. The consistency of project cost information allows for greater insight when it comes to planning for future projects.
Things to Consider
- Required User Permissions:
- 'Full Access' to the project or higher.
Note: Users with 'Full Access' permissions can only create custom reports for the projects they have access to.
- 'Full Access' to the project or higher.
- Additional Information:
- There can only be up to three groupings for a report.
Steps
Tip
To see a list of data points for custom reports, see What are the data points available for custom reports in Portfolio Financials and Capital Planning?- From the Dashboard, click the Reporting tab.
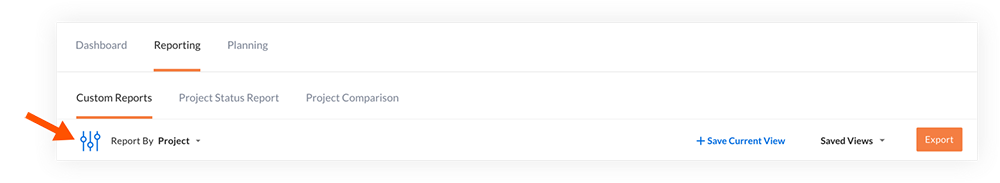
Note: The Reporting tool automatically opens the Custom Reports tab. - Optional: Click the Report By drop-down and select a report type.
- Click the filters
 icon to expand the Filters panel.
- Optional: If you are looking for a specific project that is active or archived, you can use the Search bar to enter the project name.
- In the Display section, click Columns.
This expands a section where you can select the specific data points that you want to include in your report.
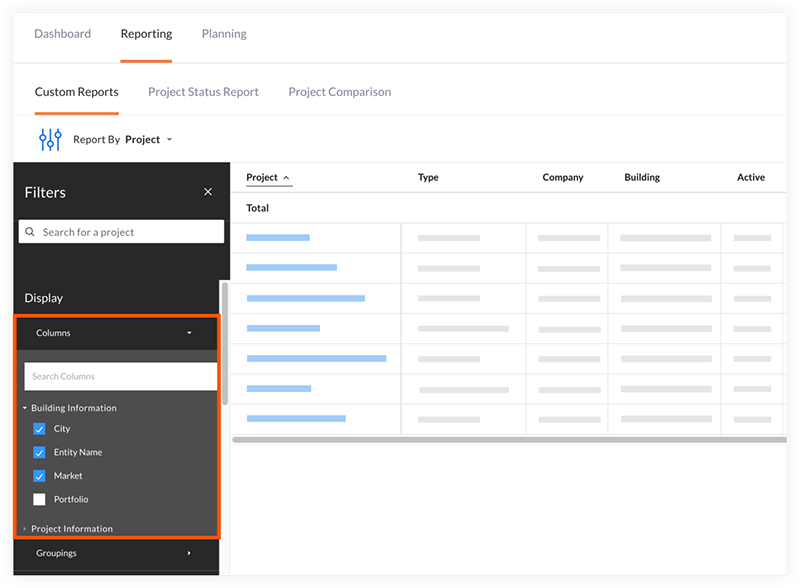
- To select columns:
- Click a section to see the options.
- Mark the checkboxes next to the columns you want to include in your report.
- To select columns:
- Click Groupings to expand the section for different grouping options. Grouping projects will calculate subtotals across projects, and it also helps to create a visual distinction.
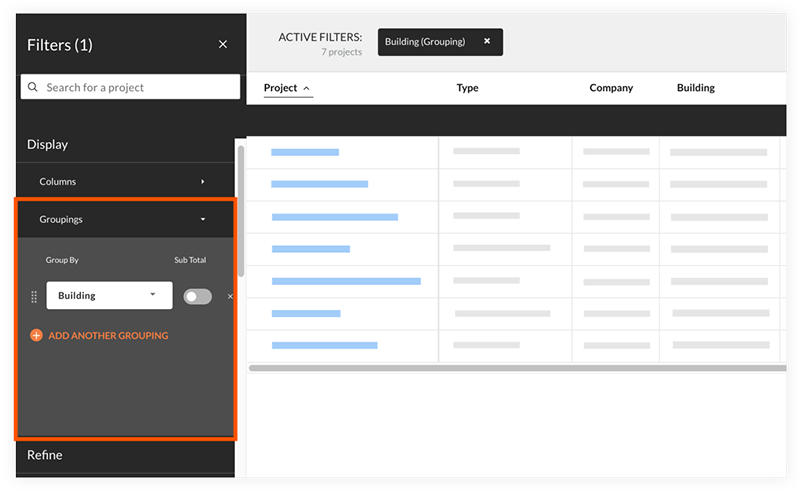
- To select or manage groupings:
- Select a data point from the drop-down menu to group by.
- The following options are available:
- To add a grouping, click the plus
 icon next to 'Add Another Grouping'.
Note: You can have up to three groupings on a report. - To delete a grouping, click the remove
 icon next to the grouping.
 - To reorder groupings, click the reorder grip
 icon and drag a grouping to another location.
 - To show sub totals for a grouping, click the Sub Total toggle to the ON
 position.
OR
To hide sub totals for a grouping, click the Sub Total toggle to the OFF position.
- To add a grouping, click the plus
- To select or manage groupings:
- To continue refining your report, scroll down to Refine.
You can use these filter options to narrow down your report. For example, you could choose to report only on projects at a single building, or projects that are in the construction stage.

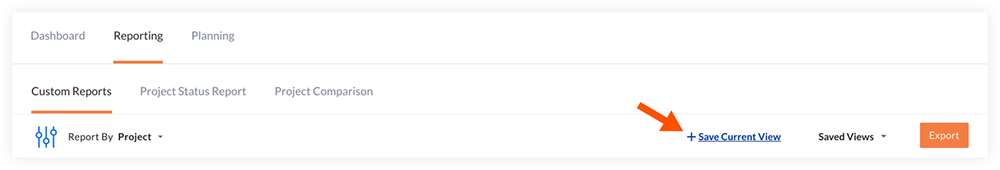
- Optional: If there is a certain combination of filters that you prefer, you can save the current report view. Views that you save can be selected at any time from the 'Saved Views' drop-down menu, and can be shared with other employees and collaborators.
- To add a new view:
- Click Save Current View.
- Enter a name for the report in the Report Name field.
- Click Save.
- To share a saved view with others:
- Click the Views drop-down menu and select the view that you want to share.
- Click Share.
- Select the users that you want to share the report with.
- After selecting the users, click Save.
The selected users will now be able to select your newly created view from the 'Saved Views' drop-down menu.
- To add a new view:
- Optional: To export a copy of the report to your computer, click Export.
A Microsoft Excel file will download to your computer.