Answer
There are several different options available for adjusting your view of a project's schedule in the Gantt chart view, such as zoom levels, filters and configurable columns.
See the steps below on how to use these features:
- Navigate to the project's Schedule tool.
- Click the Gantt tab. See View a Gantt Schedule.
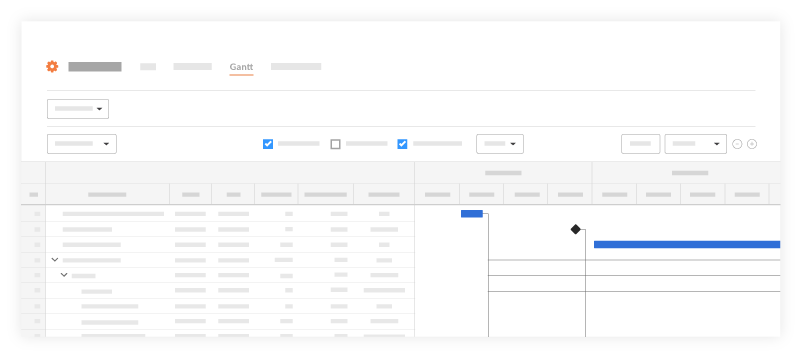
You will see a Gantt chart with horizontal bars that illustrate the amount of work done relative to the amount of time given to complete that task. The bars on the chart are based on your schedule logic. See Update a Project Schedule File.
Note: When Percent (%) Complete is enabled, the color of the bars will have a lower saturation of color to indicate the percentage that is complete.
The following options are available when viewing a Gantt chart:
- Configure Columns: Allows you to filter what columns are shown on the Gantt chart. Configured columns can also be sorted numerically or alphabetically depending on the field type.
- View Toggles: Allows you to filter what you want to show on the Gantt chart (critical paths, % complete, dependencies, etc.)
- Filter Options: Allows you to filter what you want to see on the Gantt chart. If you only want to see Critical Paths from a certain date range use the filter options to adjust the Gantt.
- Zoom Levels: Allows you to zoom in and out of the Gantt chart.


