Create a Project Single Tool Report
Objective
To add a custom report using Procore's 360 Reporting tool.
Background
The 360 Reporting tool gives users the ability to create, generate, and export customized reports. When designing a report, its author can include data captured by specific Procore tools, specify the desired column layout, and also define how to group and filter report data. After generating a report, it can also be exported from Procore into Microsoft Excel.
Things to Consider
- Required User Permissions:
- To create a single tool project report, 'Standard' permissions or higher on the project 360 Reporting tool, plus permissions for the data source tool:
- Directory: 'Admin' level permissions.
- Financial Management Tools: 'Standard' level permission or higher.
- All Other Tools (Core, Project Management, Quality & Safety): 'Read Only' level permissions or higher.
- To create a 360 project report: 'Standard' level permissions or higher on the Project 360 Reporting tool, with additional permissions depending on the field group.
- To create a single tool project report, 'Standard' permissions or higher on the project 360 Reporting tool, plus permissions for the data source tool:
- Additional Information:
- Custom reports are only visible and available to the individual who created them.
- Reports can include data from these Procore tools and sources:
- Action Plans
- Tendering
- Budget
- Change Management
- Change Event Line Item Details
- Potential Change Orders
- Change Orders
- Commitments
- Coordination Issues
- Daily Log
- Daily Construction Report Log
- Call Log
- Notes Log
- Delay Log
- Dumpster Log
- Quantity Log
- Timecard Entry
- Manpower Log
- Visitor Log
- Equipment Log
- Accident Log
- Productivity Log
- Weather Log
- Inspection Log
- Delivery Log
- Daily Log Completion
- Waste Log
- Safety Violation Log
- Directory
- Drawings
- Financial Line Items
- Configurable Budget Snapshots
- Financial Line Item Details
- Financial Line Item Summary
- Forms
- Incidents
- Incident Injury Records
- Incident Near Miss Records
- Incident Records (All)
- Incidents
- Inspections
- Inspection Item Details
- Inspection Summary
- Labor Productivity
- Meetings
- Meeting Attendance
- Meeting Items
- Meetings
- Models
- Observations
- Owner Invoices
- Owner Invoices
- Photos
- Portfolio
- Prime Contract
- Project Roles
- Deficiency List
- RFIs
- Schedule Tasks
- Schedule Tasks
- Lookaheads
- Requested Changes
- Specifications
- Subcontractor Invoices
- Subcontractor Invoices
- Submittals
- Tasks
- T&M Tickets
- Materials
- Tickets
- Timecards
- Equipment
- Timesheets
- Timecard Entries
- Production Quantities
Create a New Custom Report
- Navigate to the Project 360 Reporting tool.
- Click Create Report in the top right corner.
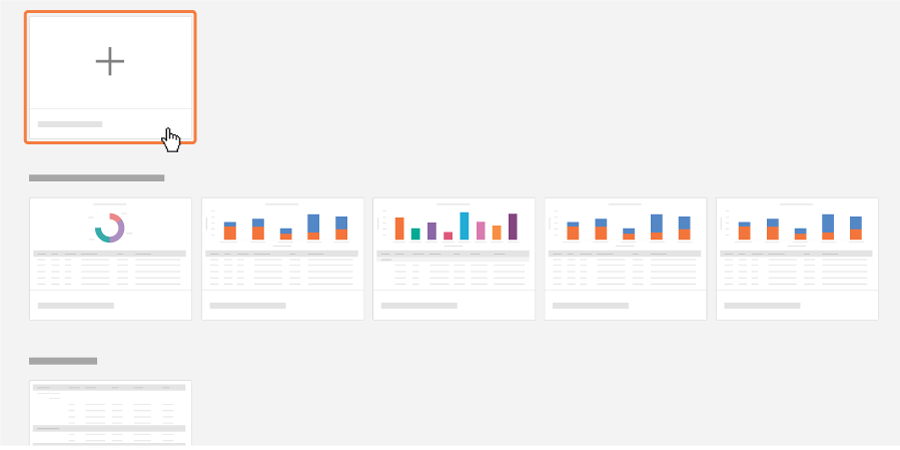
- Click Single Tool Report.
- You will then have the option to Create a New Report or choose an existing template. To create a brand new report, click the Create New Report tile.
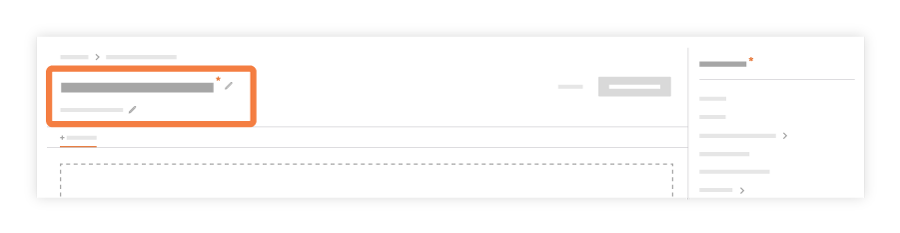
- Enter in the report name by clicking the pencil icon next to Enter Report Name.
- Enter in a description of the report by clicking the pencil icon next to Enter Description.
- In the right pane is a list of tools you can report on. Select a tool you wish to report on.
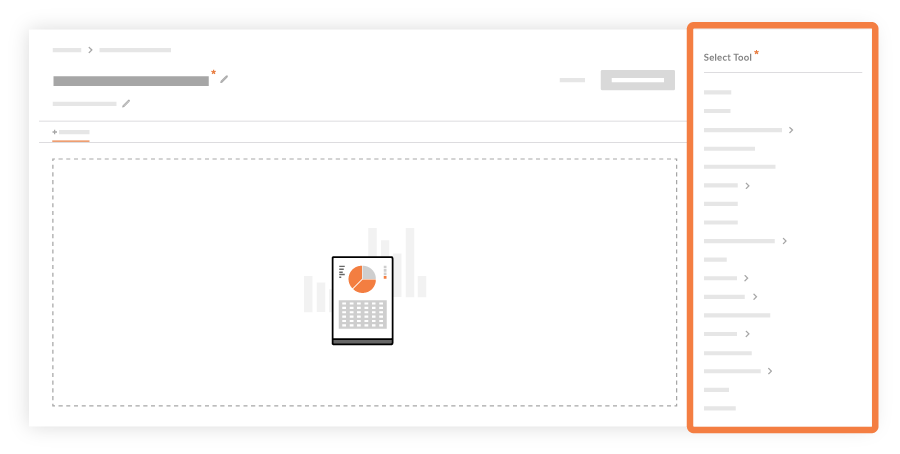
- Once you have selected a tool, the right pane will populate with a list of columns you want to add to your report. Drag and drop columns into your report, or add all of the columns by clicking Add All.
- Once you've added the desired columns, you have these options:
- Group report data
In the Group by list, select one of the items in the drop-down menu to group report data by the specified column (e.g., you may want to group data by the responsible contractor). - Filter your report data
Click the Add Filter drop-down menu to select what you would like to filter by. Once you've specified a filter, you can add another filter. You can also filter data by date range by selecting a start and end date. - Change the column order
Use a drag-and-drop operation to place the column into the desired position. - Aggregate data
Click the fx in the column and select one of the following (for numeric values): count, sum, min, max or average. Once the report is created, you will see the count, sum, min, max or average of the values at the bottom of the column. For field types that are not a numeric value, you have the option to aggregate by count.
- Group report data
- Once you've added the desired columns, you have these options:
-
To add a new tool to your report, click Add Tab at the top of the report and repeat step 6-7 above.
-
When finished configuring your report layout, click Create Report.